About
This tutorial gives you an overview of common dialogs and windows used to configure Analysis Services Tabular Projects.
Initial Dialogs
Create a New Project
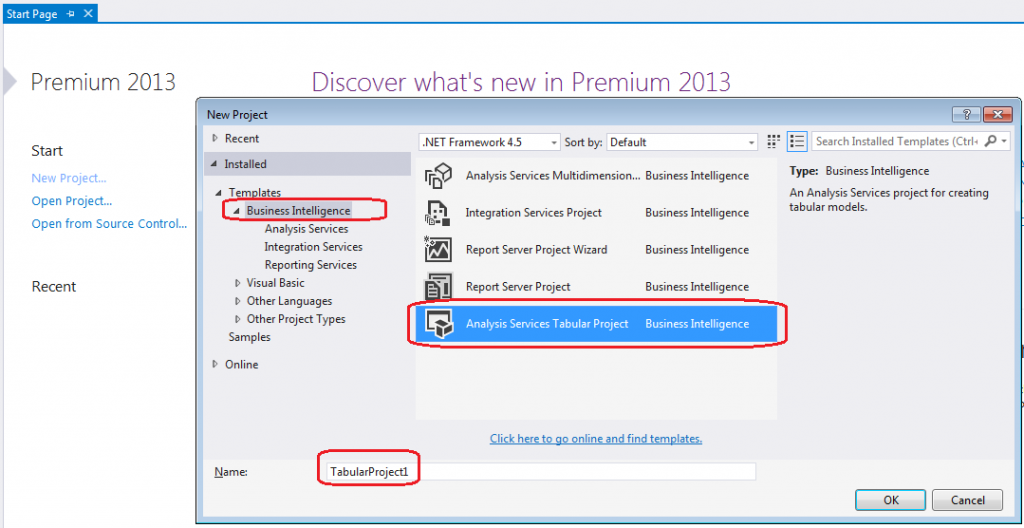
The created file will be named TabularProject1.smproj.
Tabular Model Designer (Choose a Connection)
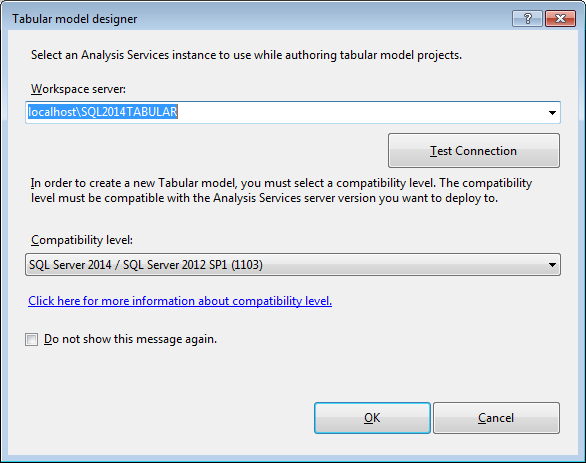
Further information on Compatibility Levels MSDN here.
Model.bim Properties window
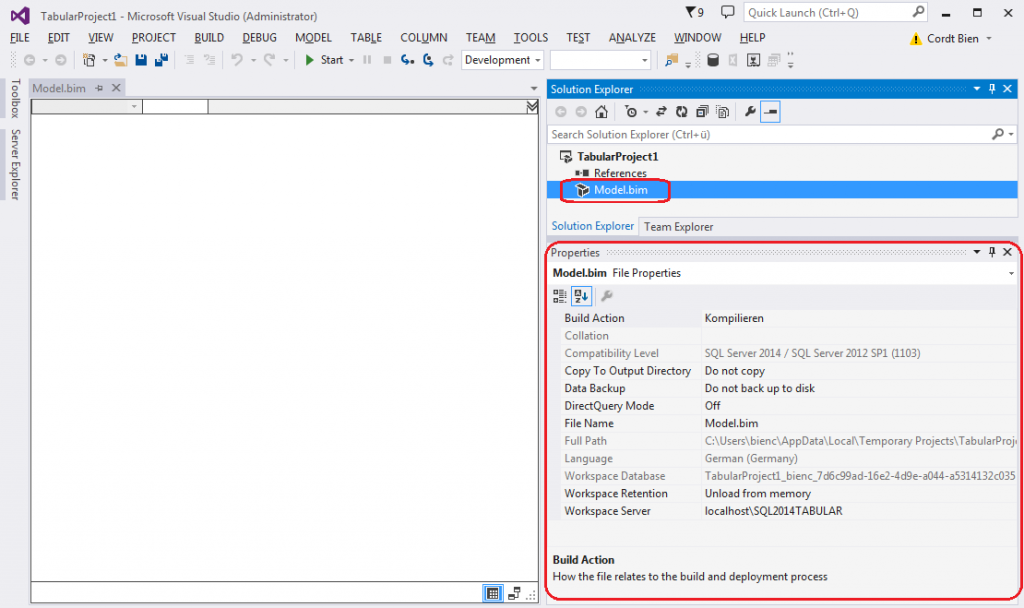
- Build Action: Compile | None
- Copy To Output Directory: Do not copy | Copy always | Copy if newer
- Data Backup: Back up to disk | Do not back up to disk
If enabled: An ABF file is automatically created when a BIM file is saved. For further information on how to a restore a .abf file see mssqltips here. For contents of the backuped .abf file see MSDN here.
- Direct Query Mode: On | Off
Benefits if enabled: Data will always be up-to-date. Data sets can be huge (larger than RAM of the SSAS instance). May be faster due to query acceleration in the data source (xVelocity column indexes for example). Security can be enforced (for example row-level security in RDBMS database). Complex formulas might be faster if the back-end can optimize the query plan. Restrictions: All your data in the Tabular Model must come from a single relational data source (either SQL Server, Oracle or Teradata). You must not use data from other sources. If you need data from elsewhere you first have to create a DWH that contains all data. Then you can use this DWH as the only source for your Tabular Model. Excel in DirectQuery mode: MDX queries from Excel to a Tabular Model is only supported in SQL Server 2016 (or above) and the compatibility level is set to 1200. For further information see MSDN here.
- Workspace Retention: Keep in memory | Unload from memory | Delete workspace
Keep in memory: The workspace database (that includes the model metadata, imported data and credentials) will be kept in memory after closing a model. Your model will load faster but you might lose all of your memory. Unload from memory: The workspace database will be written to disk on closing and reloaded into memory on reload. Should be used on a remote workspace database or if you have a limited RAM amount. Delete workspace: The workspace database will be deleted on closing your model. Your model will always need more time to load as it must restore any settings. Use this option when you are rarely working with your model.
- Workspace Server: This is the connection to a SSAS Tabular Mode Instance used for storing and editing temporary the current in-memory model. See Workspace Database property to examine the temporary database name created on this instance.
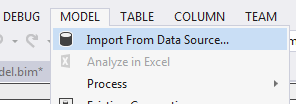
Import a new Data Model from Data Source
This section describes the steps to import related Fact and Dimension tables from Adventureworks DW 2014. Go to the menu bar in SSDT, click on MODEL and then Import From Data Source…
The Table Import Wizard opens.
Table Import Wizard Step 1
Select the relational data source instance and Database to connect to.
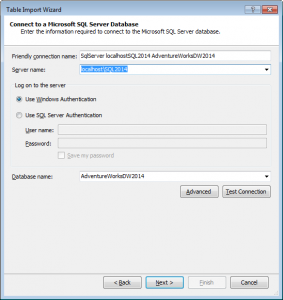
Table Import Wizard Step 2
Enter the credentials of a user specific to this project to connect to the data source. You should always try to create an Active Directory user for each Project you are creating to be able to give project specific permissions to this user in the data source. Don’t use a “sa” account.
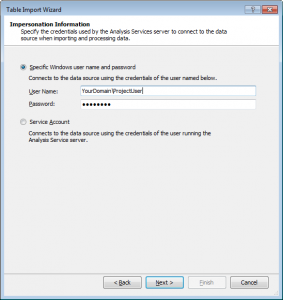
Table Import Wizard Step 3
Decide whether to select data from given tables or views or by specifying your own SQL Query.
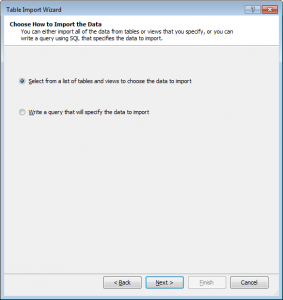
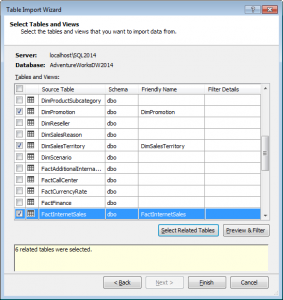
Table Import Wizard Step 4 (Select Tables and Views)
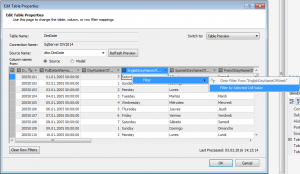
Select the Tables/Views. In this example I checked the FactInternetSales table and then used the handy Select Related Tables button.
Preview & Filter dialog:
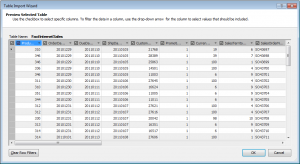
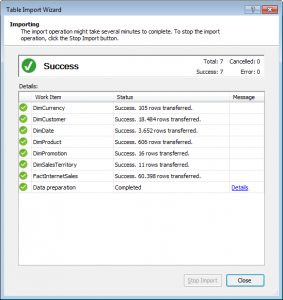
Table Import Wizard Step 5 (Finishing -> Importing)
The Data is transferred and the selected tables are imported into your model. Hit Close.
Configure your Tabular Model
When you switch to Diagram View, you will see the following result:
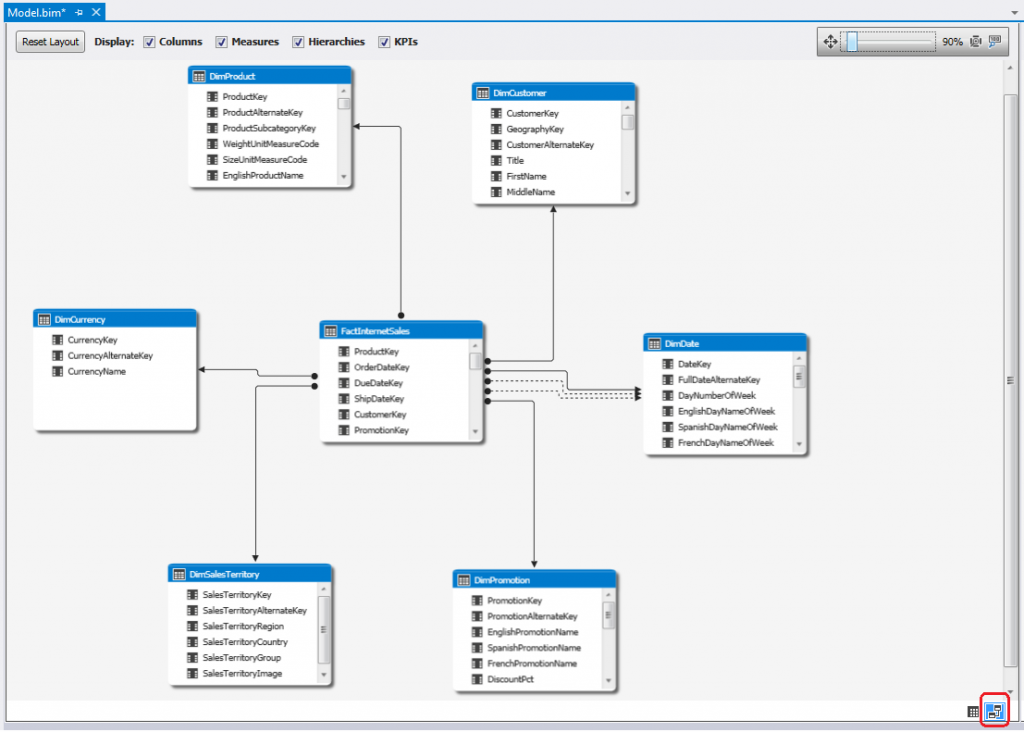
Table Properties
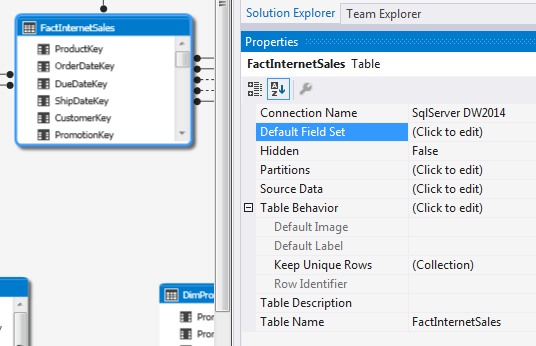
- Default Field Set: Determines which attributes are being displayed by default when a client connects to this table. See also MSDN here.
- Hidden: True | False. Specifies if the table is hidden in client tools.
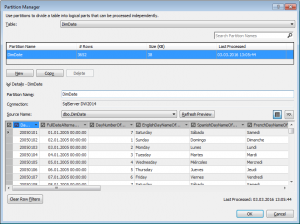
- Partitions: Lets you define logical partitions for single processing. Can be very helpful on huge tables. They allow parallel processing. See also MSDN here.
- Source Data: View or edit the source data.
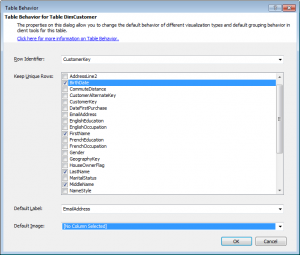
- Table Behavior: Only affects PowerView. Does not apply to Excel Pivot! You can define table behavior properties for tables of primary interest (for example: Customer, Employee, …). In most cases you do not need to set properties for these table types: Date, Category, Group, Department, Lookup and Summary tables… . For details and example of table behavior see MSDN here.
Column Properties
For an (currently in-)complete property overview see MSDN here.
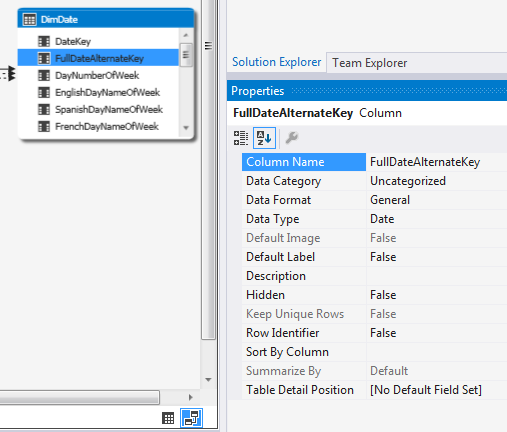
- Column Name: Name of the column stored in the model. Also referred to as Friendly Name. This property value is the name of a column displayed in client reporting tools.
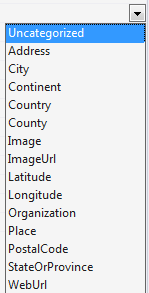
- Data Category: One of the following values:
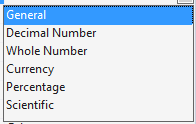
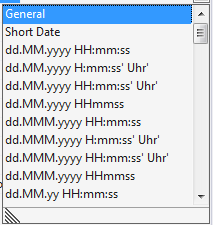
- Data Format: Lets you define the displayed format of this column in client tools. Options follow (Numeric and Date based columns). See also MSDN here.
- Data Type: Underlying Data Type used on Import. Do not change.
- Default Label: True | False. Set to true to set a specific column as the Label column displayed in client tools for this table.
- Hidden: True | False: Set to true to hide this column in client reporting tools.
- Row Identifier: True | False: Set to true to set a specific column as the unique ID column. You will use a ID or surrogate key column.
- Sort By Column: Specify another column to sort values in this column. You cannot specify a formula or measure.
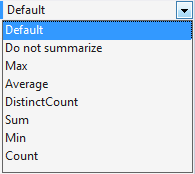
- Summarize By: By default a client reporting tool uses the SUM aggregation on values. If you need to set a specific calculation method use one of the following:
- Table Detail Position: If you have a Default Field Set defined, you may change the order of a column by setting this value.
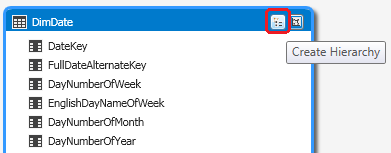
Creating a Hierarchy
We will create a Hierarchy on the Date Dimension as follows. First you will have to click the “Create Hierarchy” button on the upper right of a table:
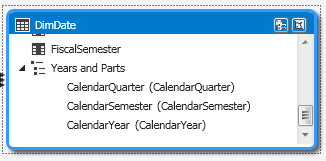
Then you will give it a name: “Years and Parts”. After that you drag & drop the following three columns onto the Years and Parts hierarchy column:
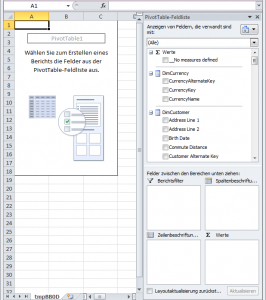
Analyze Results with Excel Pivot
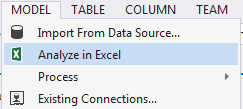
We will now analyze the results and the effects of the created hierarchy in Excel. Go to the menu bar in VS2013, open the MODEL menu and click Analyze in Excel.
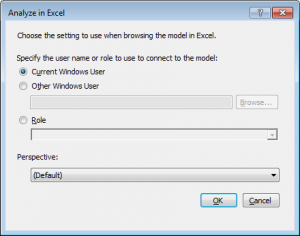
Leave the “Current Windows User” option set in the following dialog and hit OK.
Excel opens with the following result: