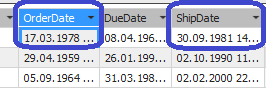
You have two Dates in your Tabular Project
- Create a new calculated column:
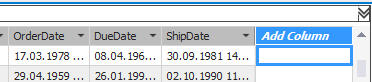
Give it the name “DeliveryDays“.
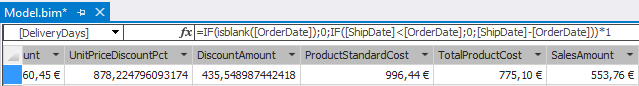
2. Enter following formula:
=IF(isblank([OrderDate]);0;IF([ShipDate]<[OrderDate];0;[ShipDate]-[OrderDate]))*1
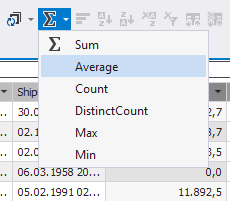
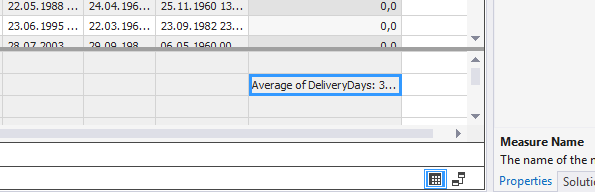
3. Go to the measure grid (bottom) and enter a new measure to the previously created column:
Average of DeliveryDays:=AVERAGE([DeliveryDays])
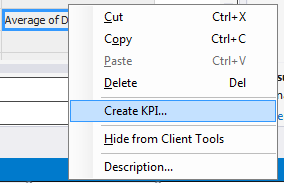
4. Create KPI by right clicking on the newly created Average measure:
5. A new dialog will pop up and you have to define the KPI details:

After hitting OK you will notice a KPI Indicator Symbol in your measure grid:

6. Analyze the Results in Excel:

This was a quick tutorial of how to create a KPI using a new calculated column in a Tabular Project using SSDT Visual Studio 2013.