New T-SQL Features in SQL Server 2016

You can now set the MAXDOP option on each database differently:

ALTER DATABASE SCOPED CONFIGURATION SET MAXDOP = 1;

Replacement for DBCC INPUTBUFFER:

sys.dm_exec_input_buffer()

Replacement for Trace Flag 1117:

AUTOGROW_SINGLE_FILE and AUTOGROW_ALL_FILES options on FileGroupLevel

Replacement for Trace Flag 1118:

MIXED_PAGE_ALLOCATION

on Database Level ^^.


See also: http://blogs.sqlsentry.com/team-posts/latest-builds-sql-server-2016/

Combine PerfMon and SQL Server Profiler Data

Found this nice in-depth blog post: https://www.simple-talk.com/sql/database-administration/correlating-sql-server-profiler-with-performance-monitor/

You should use the following measures for perfmon.exe:

<Counter>\Memory\Pages/sec</Counter>
<Counter>\PhysicalDisk(0 C:)\Disk Transfers/sec</Counter>
<Counter>\PhysicalDisk(3 D:)\Disk Transfers/sec</Counter>
<Counter>\PhysicalDisk(5 E:)\Disk Transfers/sec</Counter>
<Counter>\PhysicalDisk(0 C:)\Split IO/Sec</Counter>
<Counter>\PhysicalDisk(3 D:)\Split IO/Sec</Counter>
<Counter>\PhysicalDisk(5 E:)\Split IO/Sec</Counter>
<Counter>\PhysicalDisk(0 C:)\Avg. Disk Queue Length</Counter>
<Counter>\PhysicalDisk(3 D:)\Avg. Disk Queue Length</Counter>
<Counter>\PhysicalDisk(5 E:)\Avg. Disk Queue Length</Counter>
<Counter>\Processor(*)\% Processor Time</Counter>
<Counter>\SQLServer:Buffer Manager\Buffer cache hit ratio</Counter>
<Counter>\SQLServer:Buffer Manager\Page life expectancy</Counter>
<Counter>\SQLServer:Memory Manager\Free Memory (KB)</Counter>
<Counter>\SQLServer:Memory Manager\Total Server Memory (KB)</Counter>

If you have problems with perfmon, that your collector is in a “compiling” status and you want to terminate that Data Collector set:

  1. Write down the name of the troublesome set
  2. Close all of your PerfMon windows
  3. Open RegEdit and goto “HKEY_LOCAL_MACHINE\SOFTWARE\Microsoft\Windows NT\CurrentVersion\Schedule\TaskCache\Tree\Microsoft\Windows\PLA”
  4. Delete the SubFolder containing your Data Collector set name
  5. Re-Open perfmon.exe – the Data Collector Set is gone

Tested on a Windows Server 2012 R2.

Extracted from http://kb.itimpulse.in/?p=147

SQL Server Trace Flags

Trace Flag 1117

Should always be enabled, if you’re using more than one tempdb data file (which you usually should do :-)).

Trace Flag 1118

Should be enabled in OLTP environments to avoid contention (SGAM) by disabling mixed extent allocations in ALL databases. If enabled, the RDBMS will always allocate a new 64KB extent instead of trying to find a mixed one, in which smaller data might be stuffed. See also Book: SQL Server 2012 Internals and Troubleshooting pg 228.

Should also be enabled when using Snapshot isolation, because Snapshots are stored in tempdb. See also pg 332 and http://support.microsoft.com/kb/2154845

Downside: You may use more space (ok, not really, as long as you don’t have millions of users creating 10KB chunks…).


Supported Data Sources of SSAS Multidimensional vs. Tabular vs. Excel Power Pivot

Supported Data Sources

Source and Version Multidimensional Tabular Excel Power Pivot
2008 R2 2012 2014 2016 2012 2014 2016 2016 Direct Query
SQL Server 7.0 / 2000 yes no  no no no no no no no
SQL Server 2005 yes yes yes (no)? yes yes (no)? (no)? yes
SQL Server 2008 – 2012 yes yes yes yes yes yes yes yes yes
SQL Server 2014 ? (yes)* yes yes (yes)* (yes)* yes yes (yes)*
SQL Server 2016 ? (yes)* (yes)* yes (yes)* (yes)* yes yes (yes)*
SQL Azure Database yes yes yes yes yes yes yes yes yes
SQL Server Parallel Data Warehouse (PDW) / Analytics Platform System (APS) yes yes  yes yes yes yes yes yes yes
Oracle relational 9i, 10g, 11g yes (9.0) yes yes yes yes yes yes yes yes
Oracle relational 12g ? ? ? yes ? ? yes yes ?
Teradata relational V2R6, V12 yes (v2R6) yes yes  yes yes yes yes yes yes
IBM DB2 relational V8.1 yes (with EE only) yes yes yes yes yes yes no yes
Informix relational V11.10 no yes yes yes yes yes yes no yes
Sybase relational no yes yes yes yes yes yes no yes
Text Files (.CSV, .TAB, .TXT) no no no no yes yes yes no yes
Microsoft Excel 97-2007 (.xlsx, .xlsm, xlsb, xltx, xltm) no no  no  no  yes yes  (no)? no yes
Microsoft Excel 2010 (.xlsx, .xlsm, xlsb, xltx, xltm) no no  no  no yes yes yes no yes
Microsoft Excel 2013-2016 (.xlsx, .xlsm, xlsb, xltx, xltm) no no no no (no)? (no)? yes no ?
Excel documents in SharePoint no no no no  no  no no no no
Microsoft Access 2003 yes (x86 only) yes ? ? yes yes no no yes
Microsoft Access 2007 yes (x86 only) yes yes ? yes yes no no yes
Microsoft Access 2010 ? yes yes yes yes yes yes no yes
Microsoft Access 2013 ? ? yes yes (no)? ? yes no ?
Microsoft Access 2016 ? ? ? yes (no)? ? yes no ?
Access documents in SharePoint no no  no no   no no no no no
Power Pivot Workbook published to SharePoint no no no no  yes yes yes no yes
SSAS Analysis Services Cube (2005) no no no no yes yes (no)? no yes
SSAS Analysis Services Cube (2008-2008R2) no no no no  yes yes yes no yes
SSAS Analysis Services Cube (2012-2014) no no  no no  (yes)* (yes)* yes no (yes)*
SSAS Analysis Services Cube (2016) no no  no no  ? ? yes no (yes)*
Data Feeds Atom 1.0 format (exposed via WCF Data Service) (.atomsvc or .atom) no no  no no  yes yes yes no yes
Office Database Connection files no no no no  yes yes yes no yes


Add KPI (Key Performance Indicator) based on Delivery Days between two Dates to Tabular Project

You have two Dates in your Tabular Project

KPI your two date columns OrderDate and ShipDate


  1. Create a new calculated column:
    KPI Add/Insert a new column

Give it the name “DeliveryDays“.

2. Enter following formula:

=IF(isblank([OrderDate]);0;IF([ShipDate]<[OrderDate];0;[ShipDate]-[OrderDate]))*1

KPI Enter Formula


3. Go to the measure grid (bottom) and enter a new measure to the previously created column:

Average of DeliveryDays:=AVERAGE([DeliveryDays])

KPI Create Average Measure

KPI Created Average Measure in Measure Grid


4. Create KPI by right clicking on the newly created Average measure:

KPI Create KPI Right Mouse Click on created measure


5. A new dialog will pop up and you have to define the KPI details:

Create KPI (Key Performance Indicator) Dialog


After hitting OK you will notice a KPI Indicator Symbol in your measure grid:

KPI Indicator in measure grid after closing Dialog


6. Analyze the Results in Excel:

KPIs in Excel Pivot Table


This was a quick tutorial of how to create a KPI using a new calculated column in a Tabular Project using SSDT Visual Studio 2013.

BUG SSDT-BI Visual Studio The operation could not be completed. No such interface supported. (when saving project)

Problem

You retrieve the Exception:

Microsoft Visual Studio

The operation could not be completed. No such interface supported.

Exception

Solution

Go to Visual Studio Menu TOOLS | Options…

Under Project and Solutions | General check the Option to Save a Project during creation which is by default unchecked:

Solution

This workaround is only a solution to new projects. For your current project you may go to the temporary folder (Right Click on your Project and Open Path in Explorer) and copy the contents of your project to another place.

Data Warehouse Semantics Basics

Surrogate Keys

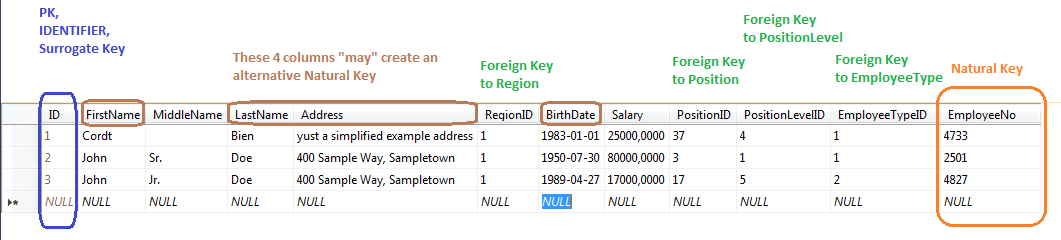
Surrogate Keys or IDs uniquely identify a record in a data set (table). Typically they (should) consist of only one column. Best example: ID column that is automatically incremented.

A Surrogate Key is also known as Meaningless Key.

Surrogate Keys should be used for internal purposes inside a relational database. They should be hidden to end users. To display unique identifiers to end users you may want to introduce an Alternate Key.

Surrogate Keys are “artificial” or a “substitute“. Some folks say a Surrogate Key is always a substitute for something and if there is nothing to substitue they cannot use the term Surrogate Key. I encourage you to be as precise as necessary.

Alternate Keys

Alternate Keys usually are a readable identifier for humans. You may want to include Alternate Keys if you need to display readable identifiers for a record to end users. It also may contain certain “meaning” in its value. This might be the case if it is derived from multiple columns of a record.

Alternate Keys may be artificial but are not limited to this. For example: A book record may contain an internal ID. It may also carry a ISBN number that may uniquely identify this book. Another example could be a product that has a Product No used in publications and order systems. This column may also be used as an Alternate Key column.

Natural Keys

Natural Keys are columns that out-of-nature create a unique identifier for a record. They contain readable text. Natural Keys may be created across multiple columns.  Examples for a natural key are an ISBN number, a social insurance number or the tuple {FirstName, LastName, Address, BirthDate}.

Natural Keys are fine and you may want to use them as a basis for your Alternate Keys for display purposes.

But !NEVER! use Natural Keys as the Primary Key column to create relations between tables!! Many years ago I worked in a fashion company in which they used readable product numbers (consisting of a category and other stuff) as Primary Keys and after 25 years of business the numbers went out. Nice work followed :-).

ID Column

An ID or Identifier column is usually a non-readable internal column used to uniquely identify a record and to create relations between tables.

I recommend naming an Identifier column with only the two letters ID. Following the DRY principle you should not repeat the table name in all columns. Sticking to this principle will also make your queries easier to read. The ID column will always be addressed by a prefix table like myTableName.ID.

Foreign Key column is always named following the schema: Table name + ID.

If your Product table has its own ID column and a ProductCategoryID column then it is easy to understand what might be the PK (*) and what is a FK to another table.

Imagine you have a large table with 20 Foreign Keys to other tables and its own ID column. It’s easy using Intellisense to distinguish the ID column from all the other Foreign Keys without having to find out the name of the column that is the ID column of that table (as this must not be the Primary Key and therefore marked with a yellow key symbol).

I encourage you to use the term ID in relational databases and omitting the term Key from being used in an OLTP system.

You may use the term Key as a substitue for the term ID in Data Warehouse scenarios. But please decide on which term you exclusively want to use.

Don’t start mixing Key with ID columns in the same database!

IDs, Surrogate Key, Alternate Keys

Conformed Dimension


Non-Conformed Dimension


Shared Dimension


Normalized Dimension


Denormalized Dimension


Degenerated Dimension


Additive Measures


Semi-additive Measures


Non-additive Measures


Analysis Services Tabular Project Dialogs in SSDT-BI

About

This tutorial gives you an overview of common dialogs and windows used to configure Analysis Services Tabular Projects.

Initial Dialogs

Create a New Project

New Analysis Services Tabular Project Dialog

The created file will be named TabularProject1.smproj.

Tabular Model Designer (Choose a Connection)

Tabular Model Designer

Further information on Compatibility Levels MSDN here.

Model.bim Properties window

Model.bim Properties

  • Build Action: Compile | None
  • Copy To Output Directory: Do not copy | Copy always | Copy if newer
  • Data Backup: Back up to disk | Do not back up to disk

If enabled: An ABF file is automatically created when a BIM file is saved. For further information on how to a restore a .abf file see mssqltips here. For contents of the backuped .abf file see MSDN here.

  • Direct Query Mode: On | Off

Benefits if enabled: Data will always be up-to-date. Data sets can be huge (larger than RAM of the SSAS instance). May be faster due to query acceleration in the data source (xVelocity column indexes for example). Security can be enforced (for example row-level security in RDBMS database). Complex formulas might be faster if the back-end can optimize the query plan. Restrictions: All your data in the Tabular Model must come from a single relational data source (either SQL Server, Oracle or Teradata). You must not use data from other sources. If you need data from elsewhere you first have to create a DWH that contains all data. Then you can use this DWH as the only source for your Tabular Model. Excel in DirectQuery mode: MDX queries from Excel to a Tabular Model is only supported in SQL Server 2016 (or above) and the compatibility level is set to 1200. For further information see MSDN here.

  • Workspace Retention: Keep in memory | Unload from memory | Delete workspace

Keep in memory: The workspace database (that includes the model metadata, imported data and credentials) will be kept in memory after closing a model. Your model will load faster but you might lose all of your memory. Unload from memory: The workspace database will be written to disk on closing and reloaded into memory on reload. Should be used on a remote workspace database or if you have a limited RAM amount. Delete workspace: The workspace database will be deleted on closing your model. Your model will always need more time to load as it must restore any settings. Use this option when you are rarely working with your model.

  • Workspace Server: This is the connection to a SSAS Tabular Mode Instance used for storing and editing temporary the current in-memory model. See Workspace Database property to examine the temporary database name created on this instance.

Import a new Data Model from Data Source

This section describes the steps to import related Fact and Dimension tables from Adventureworks DW 2014. Go to the menu bar in SSDT, click on MODEL and then Import From Data Source…

Import from Data Source Menu Item

The Table Import Wizard opens.

Table Import Wizard Step 1

Select the relational data source instance and Database to connect to.

Table Import Wizard Step 1

Table Import Wizard Step 2

Enter the credentials of a user specific to this project to connect to the data source. You should always try to create an Active Directory user for each Project you are creating to be able to give project specific permissions to this user in the data source. Don’t use a “sa” account.
Table Import Wizard Step 2

Table Import Wizard Step 3

Decide whether to select data from given tables or views or by specifying your own SQL Query.

Table Import Wizard Step 3

Table Import Wizard Step 4 (Select Tables and Views)

Select the Tables/Views. In this example I checked the FactInternetSales table and then used the handy Select Related Tables button.

Table Import Wizard Step 4

Preview & Filter dialog:

Table Import Wizard Data Preview

Table Import Wizard Step 5 (Finishing -> Importing)

The Data is transferred and the selected tables are imported into your model. Hit Close.

Table Import Wizard Final Step

Configure your Tabular Model

When you switch to Diagram View, you will see the following result:

Diagram View of FactInternetSales Tabular Model

Table Properties

Table Properties

  • Default Field Set: Determines which attributes are being displayed by default when a client connects to this table. See also MSDN here.
  • Hidden: True | False. Specifies if the table is hidden in client tools.
  • Partitions: Lets you define logical partitions for single processing. Can be very helpful on huge tables. They allow parallel processing. See also MSDN here.

Partition Manager

  • Source Data: View or edit the source data.

Source Data

  • Table Behavior: Only affects PowerView. Does not apply to Excel Pivot! You can define table behavior properties for tables of primary interest (for example: Customer, Employee, …). In most cases you do not need to set properties for these table types: Date, Category, Group, Department, Lookup and Summary tables… . For details and example of table behavior see MSDN here.

Table Behavior of DimCustomer

Column Properties

For an (currently in-)complete property overview see MSDN here.

Column Properties

  • Column Name: Name of the column stored in the model. Also referred to as Friendly Name. This property value is the name of a column displayed in client reporting tools.
  • Data Category: One of the following values:

Data Category Column Properties

  • Data Format: Lets you define the displayed format of this column in client tools. Options follow (Numeric and Date based columns). See also MSDN here.

Data Format NumericData Format Date


  • Data Type: Underlying Data Type used on Import. Do not change.
  • Default Label: True | False. Set to true to set a specific column as the Label column displayed in client tools for this table.
  • Hidden: True | False: Set to true to hide this column in client reporting tools.
  • Row Identifier: True | False: Set to true to set a specific column as the unique ID column. You will use a ID or surrogate key column.
  • Sort By Column: Specify another column to sort values in this column. You cannot specify a formula or measure.
  • Summarize By: By default a client reporting tool uses the SUM aggregation on values. If you need to set a specific calculation method use one of the following:

Summarize By Column Properties

  • Table Detail Position: If you have a Default Field Set defined, you may change the order of a column by setting this value.

Creating a Hierarchy

We will create a Hierarchy on the Date Dimension as follows. First you will have to click the “Create Hierarchy” button on the upper right of a table:

Create Hierarchy

Then you will give it a name: “Years and Parts”. After that you drag & drop the following three columns onto the Years and Parts hierarchy column:

Drag & Drop Columns on Hierarchy column

Analyze Results with Excel Pivot

We will now analyze the results and the effects of the created hierarchy in Excel. Go to the menu bar in VS2013, open the MODEL menu and click Analyze in Excel.

Analyze in Excel Menu Item

Leave the “Current Windows User” option set in the following dialog and hit OK.

Analyze in Excel Start Screen

Excel opens with the following result:

Excel starts with empty pivot table


Picking the right SQL Server Data Tools (SSDT) Version for SSAS

You have SQL Server 2014 or SQL Server 2012 (SSAS/SSRS/SSIS)

You have SQL Server 2016 CTP (SSAS/SSRS/SSIS)

All of these SSDTs also support SQL Server 2008 and 2008 R2.

If you only have SQL Server 2008 or SQL Server 2008 R2

  • install Business Intelligence Development Studio (BIDS) via SQL Server 2008/R2 Setup


If you picked the SSDT-BI for VS2013 version, the installation will look like this:

SSDT-BI for VS2013 on SQL2014 Setup